
Why use charts?
Charts serve as powerful tools for conveying a wealth of information in a concise visual format. At a more abstract level, they act as visual representations of the ongoing dynamics between buyers and sellers in the market.
What is a line chart?
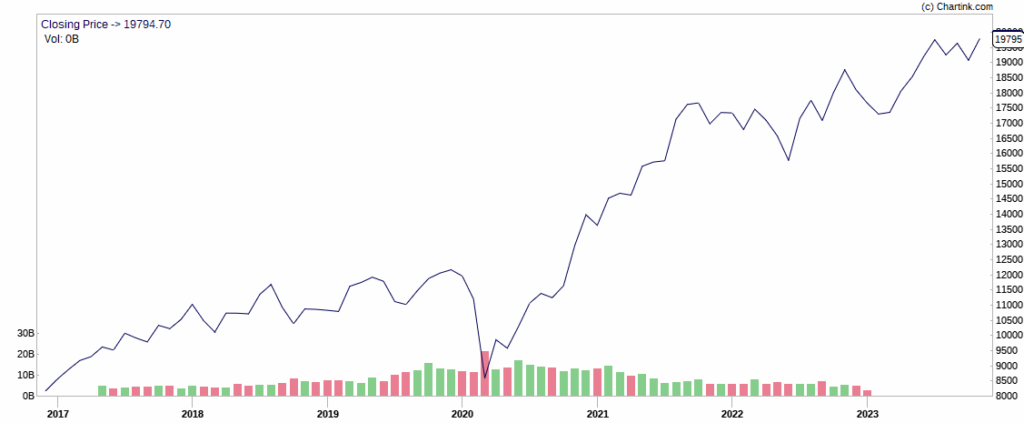
A line chart stands as the fundamental and uncomplicated variant of stock charts utilized in technical analysis. Referred to as a close-only chart, it charts the closing prices of the underlying stock by connecting the dots formed by these closing prices with a line.
In a line chart, the price data for the underlying stock is graphically represented, with time progressing from left to right on the horizontal axis (x-axis) and price levels ascending from the bottom on the vertical axis (y-axis). Typically, the price data used in line charts is the closing price of the underlying stock. However, it’s essential to note that line charts don’t provide information about the highs and lows, thereby omitting details about the price range for a given session.
Despite this limitation, line charts held favor with Charles Dow, who prioritized the closing price as the most crucial piece of data for a trading period. Dow believed that the closing price determined the unrealized profit or loss for that specific session.
What is candlestick charts?
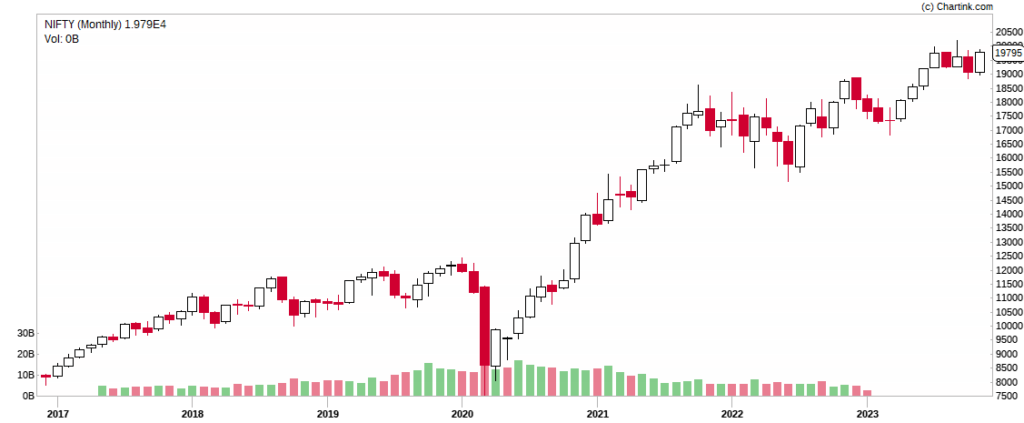
Candlestick charts, originating from 17th-century Japan and introduced to the global financial community through Steve Nison’s book, “Japanese Candlestick Charting Techniques,” represent one of the oldest forms of technical analysis. Developed by a Japanese rice trader named Homma, these charts go beyond simply conveying open, high, low, and close prices for a designated period. They offer a visual insight into market psychology, sentiment, and potential vulnerabilities, making them a valuable and nuanced trading tool. In essence, candlestick charts not only provide numerical data but also serve as a graphical representation of the intricacies of market dynamics.
How Candles are constructed???
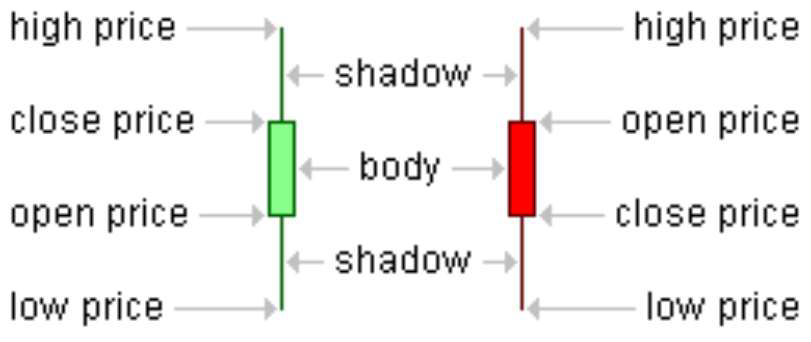
Candlesticks serve as visual representations of market sentiment and price movements, employing distinct colors to signify bullish and bearish trends. A bullish (up) bar is depicted with a light color such as white or green, indicating that the closing price is higher than the opening price. Conversely, a bearish (down) bar is represented with a darker color like black or red, signaling that the closing price is lower than the opening price. On a green candlestick, the close price resides at the top of the candlestick’s real body, while the open price is positioned at the bottom due to the higher close.
For both bullish and bearish candlesticks, the high and low prices for the session are denoted by the top and bottom of the thin vertical line extending above and below the real body. This vertical line is commonly referred to as the shadow or the wick.
It’s crucial to note that the shape and color of a candlestick can undergo multiple changes during its formation. Consequently, traders are required to exercise patience and wait for the candlestick to fully form at the end of the designated time frame before analyzing it. This waiting period ensures a comprehensive understanding of the candlestick’s final characteristics, emphasizing the importance of waiting for the bar to close before drawing conclusions.
Leave a Reply