
Understanding Uptrends and How to Identify Them
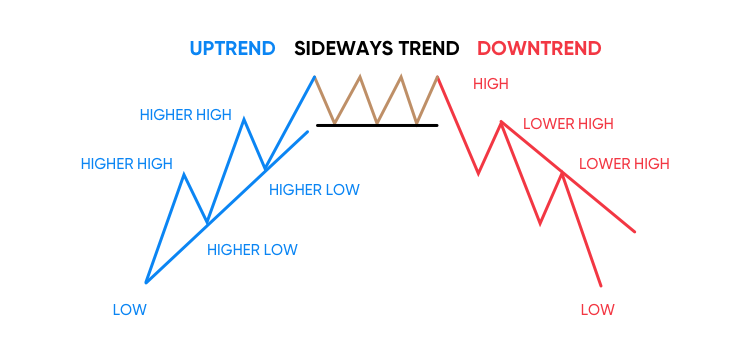
An uptrend in the financial markets refers to a sustained increase in the prices of assets over time. Identifying an uptrend is crucial for traders and investors looking to capitalize on rising market conditions. One of the primary ways to recognize an uptrend is by analyzing the price chart. In an uptrend, you’ll observe a series of higher highs and higher lows. This upward pattern signifies a bullish sentiment, indicating that buyers are consistently pushing the prices higher.
To confirm an uptrend, technical indicators such as moving averages can be employed. A moving average smoothens price data to create a single flowing line, making it easier to identify the underlying trend. In an uptrend, the price tends to stay above the moving average, providing confirmation of the bullish momentum.
Additionally, uptrends often coincide with increasing trading volumes. Higher volumes indicate a strong level of participation and support for the upward price movement. By combining chart analysis with technical indicators and volume observations, traders can confidently identify and act upon uptrends in the market.
Deciphering Downtrends and How to Spot Them
A downtrend in financial markets refers to a persistent decline in the prices of assets. Recognizing a downtrend is crucial for investors and traders seeking to protect their investments or profit from falling markets. To identify a downtrend, examine the price chart for a series of lower highs and lower lows. These lower points indicate a bearish sentiment, with sellers dominating and pushing prices downward.
Technical indicators such as moving averages can be valuable tools in confirming a downtrend. In a bearish market, prices often stay below the moving average, providing a visual representation of the prevailing negative momentum. Additionally, monitoring trading volumes can offer further confirmation of a downtrend. Increasing volumes suggest heightened selling activity and a strong commitment to driving prices lower.
Successful traders often combine these methods to confidently identify and navigate downtrends. By staying vigilant and utilizing both chart patterns and technical indicators, investors can make informed decisions to either protect their portfolios or take advantage of bearish market conditions.
Navigating Sideways Trends and How to Recognize Them
A sideways trend, also known as a horizontal or range-bound market, occurs when the prices of assets move within a relatively narrow range without a clear upward or downward direction. Identifying a sideways trend is essential for traders, as it signals a lack of strong market sentiment and can present unique opportunities.
To recognize a sideways trend, look for a pattern of consistent highs and lows that do not show a clear upward or downward trajectory. The price chart will typically display a flat, horizontal movement, indicating a balanced struggle between buyers and sellers.
Technical indicators such as Bollinger Bands, which measure price volatility, can be useful in identifying sideways trends. In a range-bound market, prices often fluctuate within the bands without a clear trend direction. Additionally, monitoring support and resistance levels can help confirm a sideways trend, as prices tend to bounce between these boundaries.
Traders navigating sideways trends may adopt different strategies, such as range trading or employing oscillators like the Relative Strength Index (RSI) to identify potential entry and exit points within the established range. By understanding and recognizing sideways trends, traders can adapt their strategies to capitalize on market conditions where traditional trends are not prevalent.
Leave a Reply