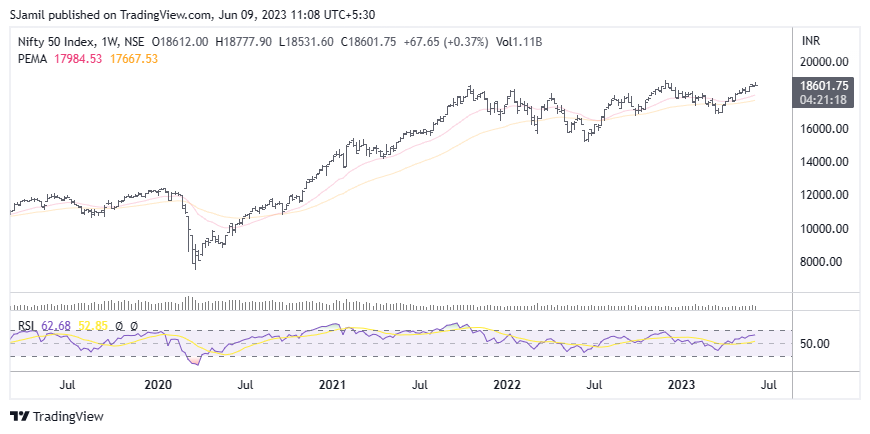
Combining technical indicators can enhance trading strategies by providing multiple perspectives on market conditions. In this blog post, we will explore a trading strategy that combines the Relative Strength Index (RSI) and Moving Average (MA) to identify potential trade opportunities and improve decision-making. This strategy aims to capitalize on trends while mitigating false signals and minimizing risk.
Strategy Overview: The RSI-Moving Average trading strategy combines trend-following principles with overbought/oversold conditions to generate trade signals. It involves using the RSI to identify potential trend reversals and the moving average to confirm the direction of the trend. By combining these indicators, traders can enter trades with higher confidence and increase the probability of capturing profitable price movements.
Step 1: Identifying the Trend with Moving Averages To determine the overall trend, we will use a combination of two moving averages: a shorter-term moving average (e.g., 20-period) and a longer-term moving average (e.g., 50-period). When the shorter-term moving average is above the longer-term moving average, it indicates an uptrend. Conversely, when the shorter-term moving average is below the longer-term moving average, it signals a downtrend. Wait for the moving averages to align in the desired direction before proceeding to the next step.

Step 2: Identifying Overbought/Oversold Conditions with RSI The RSI is a momentum oscillator that measures the speed and change of price movements. It oscillates between 0 and 100, with readings above 70 indicating overbought conditions and readings below 30 indicating oversold conditions. We will use these thresholds to determine potential trade setups.
For Long Trades: a. Wait for the moving averages to confirm an uptrend. b. Monitor the RSI for a pullback to or below 30, indicating an oversold condition. c. When the RSI crosses back above 30, it suggests a potential buying opportunity. d. Enter a long trade when the RSI crosses above 30 and the price is above the shorter-term moving average.
For Short Trades: a. Wait for the moving averages to confirm a downtrend. b. Monitor the RSI for a pullback to or above 70, indicating an overbought condition. c. When the RSI crosses back below 70, it suggests a potential selling opportunity. d. Enter a short trade when the RSI crosses below 70 and the price is below the shorter-term moving average.
Step 3: Managing the Trade Once a trade is entered, it is essential to implement risk management techniques. Consider setting a stop-loss order below the recent swing low for long trades and above the recent swing high for short trades. Additionally, consider using trailing stops or moving the stop-loss level to protect profits as the trade progresses.
Conclusion: The RSI-Moving Average trading strategy combines the power of trend identification with overbought/oversold conditions. By waiting for moving averages to confirm the trend direction and using the RSI to identify potential trade setups, traders can make more informed decisions. Remember to test and optimize the strategy on historical data, adjust the parameters to suit different markets and timeframes, and practice sound risk management techniques to enhance the strategy’s effectiveness.

Leave a Reply