
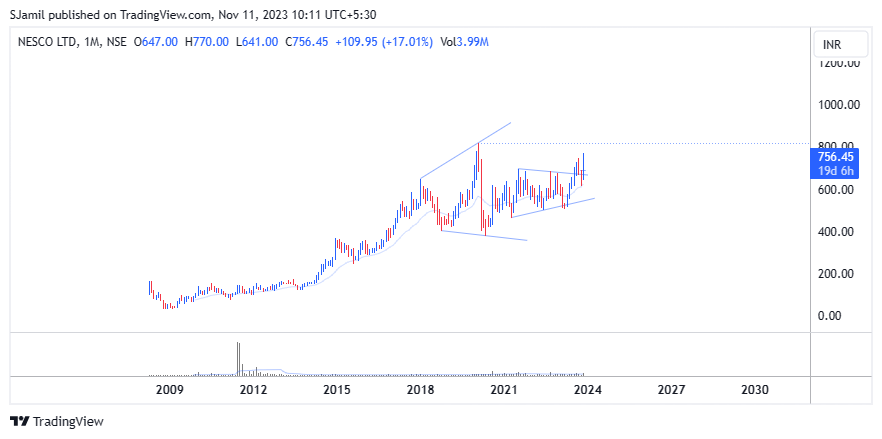
The mentioned broadening wedge pattern in the price chart of NESCO suggests a potential continuation of the upward trend, as such patterns are often considered bullish. Investors and analysts may interpret this as a positive signal for the company’s future performance.
The reported consolidated quarterly (Q2) numbers for NESCO in September 2023 indicate positive growth across various financial metrics compared to the same period in 2022. Here is a summary of the key financial figures:
Net Sales:
- September 2023: Rs 174.85 crore
- September 2022: Rs 142.87 crore
- Change: Up 22.38%
The significant increase in net sales suggests improved revenue generation for NESCO during the reported quarter.
Quarterly Net Profit:
- September 2023: Rs 87.80 crore
- September 2022: Rs 81.90 crore
- Change: Up 7.2%
The company has experienced a growth in net profit, indicating better profitability in Q2 2023 compared to the same period in the previous year.
EBITDA (Earnings Before Interest, Taxes, Depreciation, and Amortization):
- September 2023: Rs 131.69 crore
- September 2022: Rs 116.62 crore
- Change: Up 12.92%
The increase in EBITDA reflects improved operational performance, as it measures the company’s operating profitability.
Earnings Per Share (EPS):
- September 2023: Rs 12.46
- September 2022: Rs 11.62
- Change: Increase in EPS
The rise in EPS indicates enhanced earnings on a per-share basis, a positive sign for shareholders.
Leave a Reply