

Fundamental analysis involves a comprehensive examination of a company’s financial and economic aspects, such as revenue, earnings, assets, liabilities, and industry trends. The purpose is to assess the company’s financial health, management quality, and industry conditions to determine its intrinsic value and potential for future growth. The goal is to ascertain whether a stock is undervalued or overvalued in relation to its fair value.
Conversely, technical analysis is a methodology that assesses securities by analyzing statistical data derived from market activity, including historical prices and trading volume. This approach is grounded in the belief that market trends, as depicted in charts and other technical indicators, can serve as predictors of future market behavior. Technical analysts aim to identify patterns and trends in stock market activity through the study of charts and indicators to inform their investment decisions.
Successful investors often employ a combination of both fundamental and technical analysis, recognizing that each approach has its strengths and weaknesses. The choice between these methods ultimately hinges on an individual investor’s specific investment objectives, risk tolerance, and personal preferences.
Why technical analysis?

When considering buying shares, two crucial questions must be addressed: “What to buy” and “When to buy.” Fundamental analysis is adept at answering the former question, delving into the study of a company’s financial statements, cash flow, and market conditions to gauge its future prospects. It seeks to determine whether a company is a sound long-term investment and if its potential future value surpasses its current valuation.
However, merely identifying excellent companies for long-term investments doesn’t conclude the process. The subsequent challenge is determining the optimal timing for the purchase, answering the question “When to buy.” A prudent approach involves not immediately purchasing shares the next day after selection. Instead, it involves identifying a price range where the risk-to-reward ratio is most favorable.
This is where technical analysis comes into play. It involves the study of price charts and chart patterns. While technical analysis provides insights into potential future market movements, it’s essential to understand that it offers probabilities rather than certainties. In essence, it guides investors by indicating potential opportunities but doesn’t guarantee outcomes. Therefore, a comprehensive investment strategy often involves a combination of fundamental and technical analysis to make well-informed decisions regarding both what and when to buy shares.
Example:
Bharti Airtel is a very good long term Investment (do your own analysis to find out why, but it is :)).
On 1.11.2022, Ajay and Robert want to invest Rs 1 lac in Bharti Airtel for long term. Both of them understand that Bharti Airtel is truly long term buy.
Ajay invests in Bharti Airtel on next day, because share is going up and he feels it’s a good time to enter in it. He buys the stock at Rs 848.
After some days Stock starts falling and reaches around Rs 741. Robert buys the stock at that time. See the Chart Below
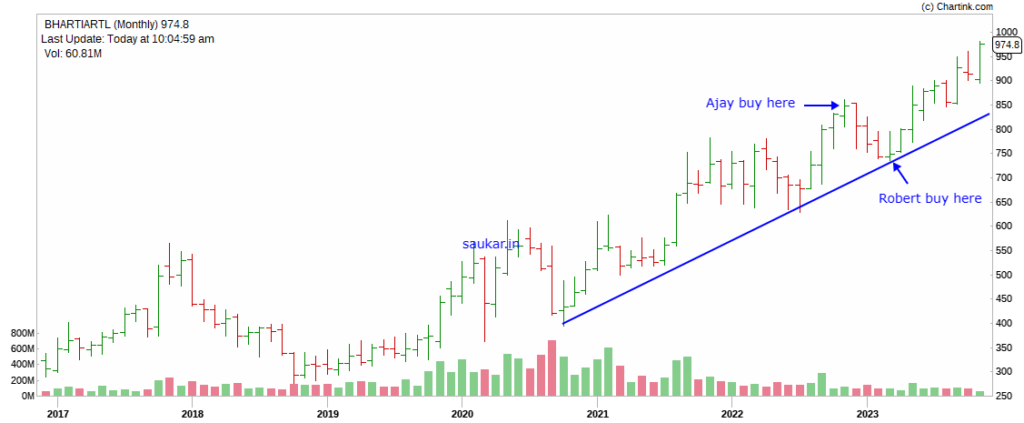
Here you can see that Robert has got the stock at almost 12% lower price, which means his profits will always be more than Ajay’s by that much.
What did Robert do? Robert used simple Technical Analysis concepts and entered in the stock with better prices.
Leave a Reply