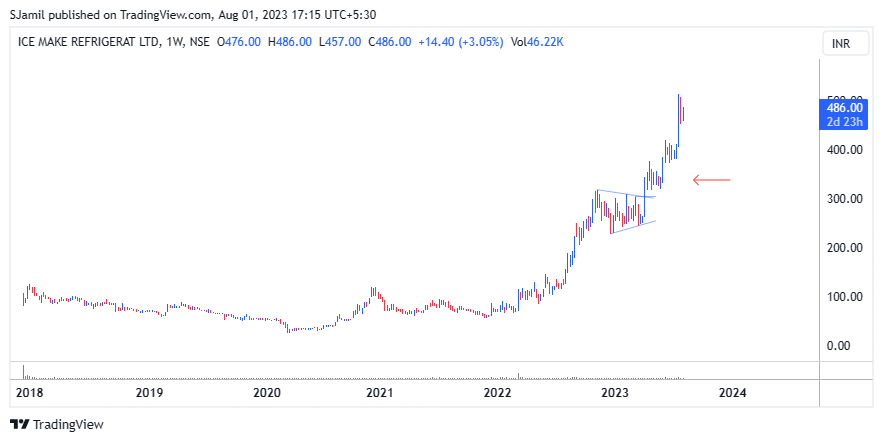
Our keen eye for patterns served us well when we noticed the symmetrical triangle formation in ICEMAKE’s stock chart in our previous blogpost. The triangle pattern, characterized by its converging trend lines, often signals an impending breakout or breakdown. In the case of ICEMAKE, the stock price successfully broke out from the triangle pattern, confirming a potential upward movement.
The breakout in ICEMAKE unfolded beautifully, resulting in an impressive 50% profit return on our investment.

Previous blogpost: click here

Leave a Reply