
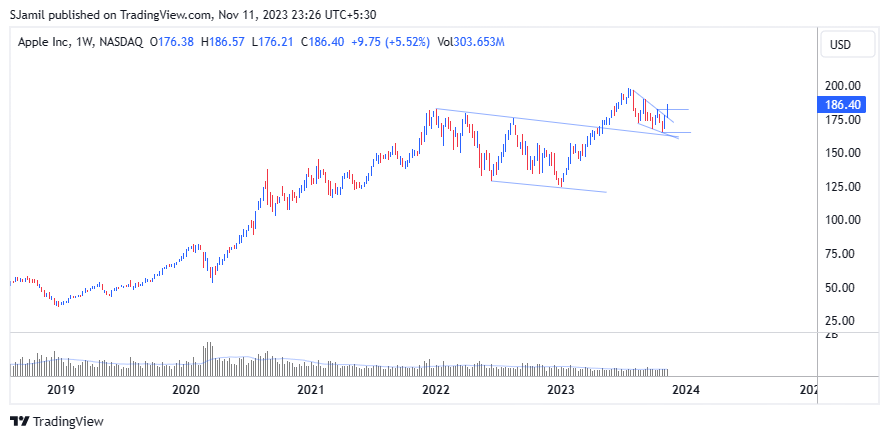
The Apple price chart is displaying an intriguing pattern. After trading within a 30% price range in an inclined channel for the past five months, a significant breakout occurred in early June this year. The stock prices have since successfully retested this breakout, forming a bullish flag, and are anticipated to move in a positive, upward direction.
Leave a Reply