
I typically avoid engaging in reversal plays until I observe compelling indications. Recently, I received numerous requests to analyze Wipro stock on my WhatsApp. Consequently, I have conducted a technical analysis of Wipro stock.
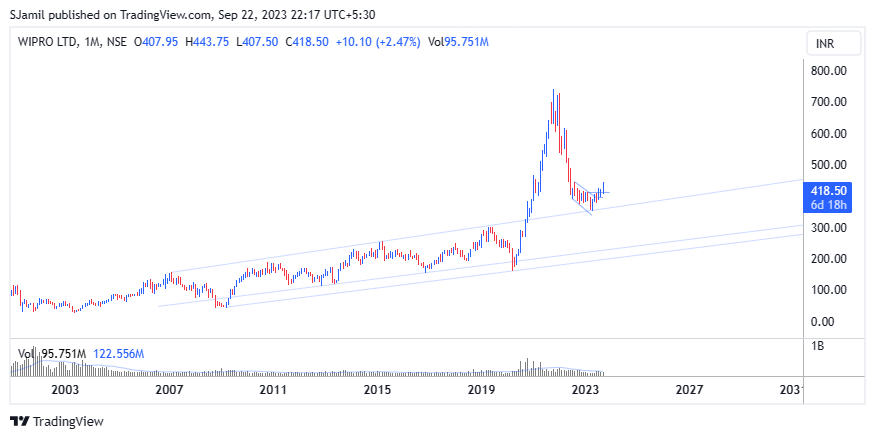
As evident from the chart, the stock initiated a steep decline from its 740-level peak, experiencing a significant downward momentum until it reached 390. Subsequently, it began to lose momentum and entered a descending channel, finding support at the substantial pre-existing rising channel level of 352 in April 2023.
At present, the stock has broken out of this descending channel, marking the first indication of a potential trend reversal, as it surpassed the 413 level that previously hindered its downward momentum. However, for a definitive reversal to occur, the stock must demonstrate strength and maintain a position above 450. This will serve as a critical signal for a clear trend reversal in the stock’s performance.
Leave a Reply