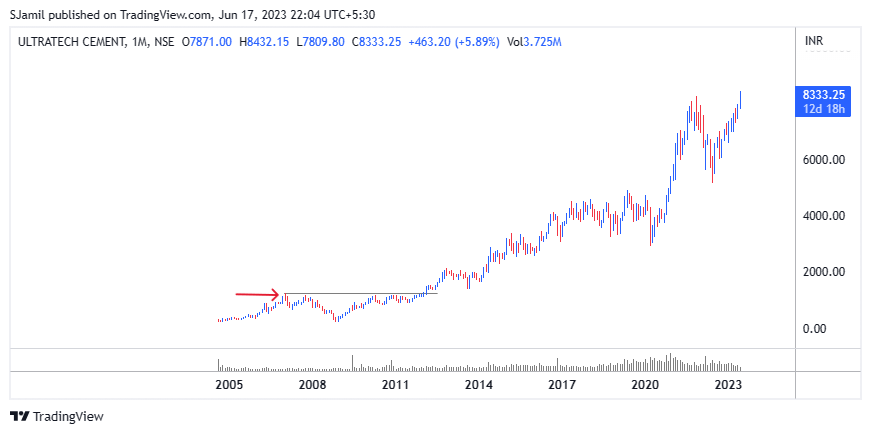
Introduction: Investing in stocks can be a rewarding endeavor, but it requires careful analysis and decision-making. One popular approach for identifying potentially lucrative investment opportunities is technical analysis. By examining stock price patterns and indicators, investors can gain insights into market trends and identify stocks that may be bottoming out. In this blog post, we will explore how to use technical analysis to find bottoming out stocks for investment purposes.
- Understand the Concept of Bottoming Out: Before delving into technical analysis, it’s essential to understand the concept of bottoming out. Bottoming out refers to a situation where a stock’s price has experienced a prolonged downtrend and appears to be reaching a point of reversal. It suggests that the stock may have reached its lowest price and could potentially begin an upward trend.
- Identify Reversal Patterns: Technical analysis involves studying price charts and identifying specific patterns that indicate potential reversals. Some common reversal patterns to look for include:
a. Double Bottom: This pattern occurs when a stock’s price reaches a low point, bounces back, declines again, and then rebounds from a similar level. It suggests that buying pressure is increasing, indicating a possible reversal.
b. Inverted Head and Shoulders: This pattern consists of three drops, with the middle drop (the head) being the lowest and the two surrounding drops (the shoulders) at a higher level. The neckline connects the highs of the pattern. A break above the neckline indicates a potential reversal.

c. Falling Wedge: This pattern is characterized by a series of lower highs and lower lows, forming a wedge shape. It suggests that the stock’s price may reverse its downward trend and start moving upward.
- Use Indicators: Technical analysis also involves utilizing various indicators to confirm potential trend reversals. Some commonly used indicators include:
a. Moving Averages: Moving averages help smooth out price fluctuations and identify trends. When the stock’s price crosses above its moving average, it can indicate a potential bottoming out.
b. Relative Strength Index (RSI): RSI measures the stock’s overbought or oversold conditions. An RSI below 30 suggests the stock may be oversold, indicating a potential reversal.
c. Volume: Increasing trading volume during a price decline followed by a decrease in volume during a rebound can indicate a bottoming out scenario.
- Confirm with Support Levels: Support levels are price levels at which the stock has historically found buying interest and bounced back. Identifying strong support levels that coincide with the reversal patterns or indicators can increase confidence in the potential bottoming out scenario.
- Consider Fundamental Analysis: While technical analysis focuses on price patterns and indicators, it’s important not to overlook fundamental analysis. Evaluating a company’s financial health, industry trends, and future prospects can provide valuable insights into the stock’s potential for recovery.

Leave a Reply