
The symmetrical triangle is a technical analysis chart pattern that represents price consolidation and signals the continuation of the previous trend. It is one of the most common triangle chart patterns and is widely used by technical traders to identify entry and exit points.
Symmetrical triangle consists of the two converging trend lines as the price action moves sideways. It’s important that we correctly identify the symmetrical triangle chart pattern and draw the lines precisely in order to make sure that we don’t miss out on a breakout/down
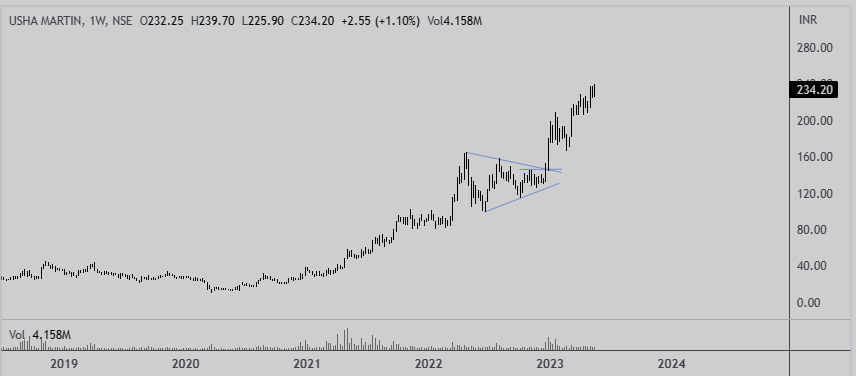
In the above chart of Usha Martin (NSE:USHAMART), we can see the price consolidation phase following a bullish movement. The price action trades sideways with lower highs and higher lows and eventually, the two converging trend lines meet.
For traders, this is the perfect entry level with a stop loss at the lowest level of the previous ‘bearish’ price swing.
Taking this information into account, here are the steps you need to take when trading the symmetrical triangle candlestick pattern:
- Identify price consolidation during a bullish or bearish trend
- Find and draw a descending upper trendline with lower highs and an ascending lower trendline with higher lows.
- Enter a trade in the direction of the breakout. It’s advisable to wait for the first candle after the breakout to close below or above the trend line
- Set a stop-loss order
In the above case of Usha Martin stock has delivered 60% profit from breakout level (at 147) and still some upside potential (up to 265) is left in it.
Leave a Reply